Introduction
Precision oncology has transformed cancer care, enabling targeted therapies tailored to tumour biology. Yet one fundamental challenge persists: knowing whether treatment is actually working. For decades, oncologists relied on imaging scans to assess response, waiting weeks or months for tumour size changes on CT or MRI. By the time these anatomical shifts became visible, critical treatment windows had often closed.
Treatment response monitoring (TRM) bridges the gap between treatment administration and timely clinical decisions. It encompasses the systematic tracking of biological changes—from tumour shrinkage to molecular signals in blood—enabling oncologists to answer a crucial question in real time: is this therapy helping my patient?
Standard imaging addresses that question too slowly. Imaging-based approaches measure only gross anatomical changes, missing microscopic residual disease and molecular responses that occur weeks earlier. In breast cancer patients, molecular progression via circulating tumour cells preceded radiological progression by a mean of 4.5 months—a gap that can determine survival outcomes.
The delay is compounded in immunotherapy. Pseudoprogression affects 6% of patients, causing premature discontinuation of effective treatments under standard RECIST criteria. Without more sensitive monitoring, clinicians risk acting on misleading data.
The field is shifting toward molecular monitoring strategies, particularly liquid biopsy-based approaches that detect circulating tumour DNA (ctDNA). These methods enable earlier, more sensitive detection of treatment failure and resistance. This guide covers the full spectrum of TRM methods and their clinical applications, including how reliable cfDNA extraction underpins every accurate result downstream.
Key Takeaways
- Treatment response monitoring tracks therapy effectiveness through biological changes over time, from tumour shrinkage to molecular signals in blood
- Traditional RECIST imaging remains standard but lags molecular changes by months and misses microscopic disease
- Liquid biopsy (especially ctDNA) detects progression 2.6–3.4 months earlier than imaging, enabling treatment switches that double survival
- Pre-analytical quality in collection, processing, and extraction determines whether ctDNA results are reliable enough for clinical decisions
- Automated cfDNA extraction platforms minimise manual errors and ensure reproducibility across serial monitoring timepoints
What Is Treatment Response Monitoring?
Treatment response monitoring is the systematic evaluation of how a patient's cancer responds to therapy over time, using measurable clinical, radiological, or molecular endpoints. Unlike diagnosis (detecting cancer) or prognosis (predicting outcomes), TRM specifically tracks change during active treatment to guide ongoing clinical decisions.
TRM operates across multiple clinical settings:
- Adjuvant chemotherapy surveillance: Detecting microscopic residual disease (MRD) after surgery to identify patients who need systemic therapy
- Targeted therapy monitoring: Tracking molecular response to EGFR inhibitors, BRAF inhibitors, or HER2-directed agents, and detecting acquired resistance mutations before imaging progression
- Immunotherapy response assessment: Distinguishing true progression from pseudoprogression using molecular signals when imaging is ambiguous
- Post-surgical recurrence surveillance: Enabling curative re-intervention by detecting relapse months before symptoms or imaging changes
These decisions—escalating, de-escalating, or switching treatment—depend on timely, accurate response signals. In the DYNAMIC trial, ctDNA-guided decisions reduced adjuvant chemotherapy use in stage II colon cancer from 28% to 15% while maintaining non-inferior survival, sparing low-risk patients from unnecessary toxicity.
The TRM Approach Spectrum
TRM methods vary in sensitivity, timing, and clinical utility:
| Method | What It Measures | Key Limitation |
|---|---|---|
| Anatomical imaging (CT, MRI, PET) | Tumor size and anatomical change | Requires substantial disease burden; weeks-to-months for detectable shifts |
| Protein biomarkers (PSA, CA-125, CEA) | Circulating protein levels | Low specificity; often rises only after significant regrowth |
| Molecular methods (ctDNA, NGS panels, methylation) | Tumor-derived DNA signals at trace levels | Higher complexity and cost; requires validated lab workflows |
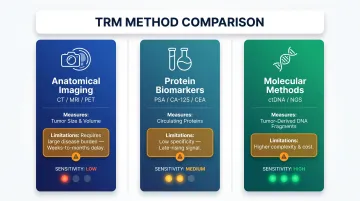
Prospective trial evidence—including DYNAMIC and several ongoing ESMO-endorsed studies—shows that ctDNA-guided treatment switching extends survival and reduces unnecessary therapy, pushing molecular methods to the front of TRM decision-making.
How Treatment Response Is Measured: Key Methods and Biomarkers
RECIST 1.1: The Clinical Standard and Its Limitations
RECIST (Response Evaluation Criteria in Solid Tumors) remains the gold standard for clinical trials and routine oncology practice. Published in 2009, RECIST 1.1 classifies responses based on tumor size changes measured on imaging:
| Response | Criteria |
|---|---|
| Complete Response (CR) | Disappearance of all target lesions; lymph nodes <10 mm |
| Partial Response (PR) | ≥30% decrease in sum of diameters from baseline |
| Stable Disease (SD) | Neither sufficient shrinkage nor growth |
| Progressive Disease (PD) | ≥20% increase plus ≥5 mm absolute increase, or new lesions |
Critical RECIST limitations:
- Cannot detect microscopic residual disease
- Relies on linear diameter measurements, ignoring tumor density, necrosis, or internal heterogeneity
- Appearance of any new lesion automatically triggers PD classification, misclassifying immune-related flare
- Inter-observer variability in target lesion selection and irregular border measurement
In immunotherapy settings, iRECIST modifies these criteria by introducing iUPD (unconfirmed progressive disease), requiring confirmatory scans 4-8 weeks later before designating confirmed progression. This addresses pseudoprogression—where tumors appear to grow due to immune infiltration despite effective treatment—but still relies on delayed anatomical changes.
Protein and Serum Biomarkers: Accessibility vs. Specificity
Serum biomarkers offer convenient monitoring but lack the precision of molecular methods:
- PSA (prostate cancer): Sensitive (73.5-100%) for recurrence detection but elevated by benign prostatic hyperplasia and prostatitis. Post-focal therapy, a 1.0 ng/mL increase over nadir at 12 months predicts recurrence.
- CA-125 (ovarian cancer): Detects relapse 2-5 months before symptoms but lacks specificity—20% of ovarian cancers don't express CA-125, and it's elevated in endometriosis, heart failure, and cirrhosis. Early CA-125-triggered chemotherapy provided no survival advantage.
- CEA (colorectal cancer): At 11.73 ng/mL cutoff, sensitivity is 100% but specificity only 74.5%, with false positives from smoking, inflammatory bowel disease, and liver disease.
These biomarkers can signal disease activity but typically rise only after substantial tumor burden has accumulated — a lag that limits early treatment adaptation. Circulating tumor DNA addresses this directly by detecting molecular changes weeks to months before imaging or serum markers reflect them.
Circulating Tumor DNA: The Emerging Molecular Standard
Circulating tumor DNA (ctDNA) refers to small DNA fragments shed by tumor cells into the bloodstream. Levels correlate tightly with tumor burden — in metastatic melanoma, correlation reached R² = 0.91 during progressive disease — making ctDNA dynamics a sensitive early indicator of response.
The lead time advantage over imaging is clinically meaningful. In the FLAURA trial of EGFR-mutant NSCLC, ctDNA progression preceded RECIST progression by a median of 3.4 months on osimertinib and 2.6 months on comparator EGFR-TKIs. In 64% of patients, ctDNA progression preceded or co-occurred with radiologic progression — providing a window for treatment modification before symptomatic failure.
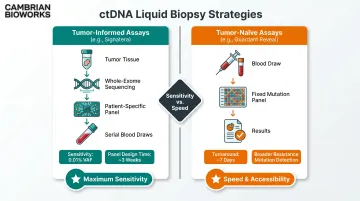
Two ctDNA monitoring strategies:
Tumor-informed assays (for example, Signatera) sequence the patient's original tumor to identify patient-specific mutations, then track those variants in serial blood draws. Analytical sensitivity reaches 0.01% variant allele frequency (VAF), enabling detection of microscopic residual disease with lead times of 2.3 months (NSCLC) to 10.1 months (colorectal cancer) ahead of imaging. The requirement for tumor tissue, whole-exome sequencing, and roughly 3 weeks for panel design is the primary constraint.
Tumor-naive assays (for example, Guardant Reveal, FoundationOne Liquid CDx) skip prior tissue sequencing entirely, using fixed panels to detect common cancer mutations. Faster turnaround (~7 days) and the ability to identify de novo resistance mutations are key strengths, though sensitivity is lower and false-positive risk increases from germline variants and clonal hematopoiesis.
PCR-Based vs. NGS-Based ctDNA Detection
PCR methods (qPCR, digital PCR, BEAMing) offer high-sensitivity, targeted mutation tracking with rapid turnaround. BEAMing demonstrated 93% sensitivity for RAS mutations compared to 67% for NGS and 47% for ddPCR. When monitoring known resistance mutations — such as EGFR T790M or C797S — across serial timepoints, PCR is the practical choice for speed and cost.
NGS-based methods (CAPP-Seq, whole-exome sequencing, targeted panels) offer broader analysis that accounts for tumor heterogeneity, excelling at detecting acquired resistance mutations and profiling multiple resistance mechanisms simultaneously. Unique Molecular Identifiers (UMIs) reduce NGS error rates from 0.1-1% to below 0.01%, critical for low-frequency ctDNA variant detection.
Emerging Non-Mutation Approaches: Methylation and Fragmentomics
DNA methylation analysis captures tumor-specific epigenetic patterns without relying on known mutations, enabling pan-cancer monitoring and detection in mutation-low tumors.
cfDNA fragmentomics measures fragment size distributions, chromosomal aneuploidy, and fragment patterns to infer tumor fraction. The DELFI-TF algorithm correlated with mutant allele frequency at r = 0.90 in metastatic colorectal cancer and detected tumor signal in 132 samples where digital PCR measured zero VAF. Patients with lower DELFI-TF slopes had overall survival of 62.8 months vs. 29.1 months (HR 3.12), demonstrating prognostic value beyond mutation-based methods.
For tumors that shed few mutations or where pseudoprogression complicates immunotherapy assessment, methylation and fragmentomics offer a route to reliable monitoring that mutation-centric assays cannot provide alone.
How Treatment Response Monitoring Works: A Step-by-Step Clinical Breakdown
Effective TRM follows a structured workflow across pre-treatment baseline, on-treatment, and post-treatment phases. Errors at any stage (especially pre-analytically) compromise the entire monitoring outcome.
Step 1 – Establish Baseline and Define Monitoring Objectives
Before starting therapy, establish a baseline measurement using the relevant method (imaging, biomarker, or ctDNA). Define the clinical question:
- MRD detection after surgery?
- Response to chemotherapy or targeted therapy?
- Early resistance to EGFR/ALK inhibitors?
- Depth of immunotherapy response?
Clarity determines which biomarkers and monitoring frequency are appropriate. For example, tumor-informed ctDNA is ideal for MRD surveillance after curative-intent surgery, while tumor-naive panels suit rapid resistance profiling during targeted therapy.
Metrics impacted: Clinical clarity, appropriate test selection, monitoring timeline design
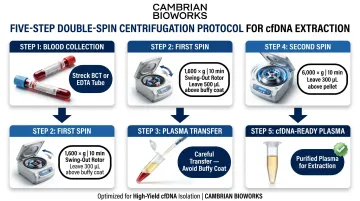
Step 2 – Collect Samples and Extract cfDNA
Blood collection for liquid biopsy requires rigorous pre-analytical control. Plasma is the standard matrix for cfDNA/ctDNA; proper sample handling prevents cfDNA degradation and genomic DNA contamination from leukocyte lysis.
Collection tube stability:
Streck cfDNA BCT tubes stabilize cfDNA for up to 14 days at 6-37°C. Standard K2 EDTA tubes require processing within 6 hours to prevent gDNA contamination. PAXgene and Roche tubes offer 7-day stability at room temperature.
Centrifugation protocol:
Double-spin centrifugation is essential:
- First spin: 1,600 x g for 10 minutes (swing-out rotor), leaving 500 µL above buffy coat
- Second spin: 6,000 x g for 10 minutes, leaving 300 µL above pellet
This removes cellular debris and minimizes gDNA contamination, preserving cfDNA integrity.
Automated cfDNA extraction:
cfDNA fragments are short (~167 bp), making gentle, validated extraction protocols essential. Automated platforms reduce manual errors, improve yield consistency, and cut processing time.
Cambrian Bioworks' Manta (CE-IVD-certified) completes cfDNA extraction in approximately 55 minutes using magnetic bead-based technology. Its open system compatibility supports diverse downstream assays — ddPCR, NGS, and methylation sequencing — while UVC contamination control and remote monitoring ensure reproducibility across serial timepoints.
Metrics impacted: Input DNA quality, yield, test sensitivity, lab reproducibility
Step 3 – Process and Analyze the Sample
cfDNA undergoes library preparation and analysis via the chosen method (digital PCR, NGS, methylation sequencing). Labs must balance depth of analysis against input DNA volume constraints — plasma yields are limited, especially in early-stage disease.
NGS workflows employ UMIs to filter sequencing errors from true low-frequency ctDNA variants. Without UMIs, error rates of 0.1-1% obscure variants below 1% VAF; with UMIs, detection thresholds drop to 0.01%.
Metrics impacted: Variant detection sensitivity, error rate, data depth and breadth
Step 4 – Interpret Molecular Changes Against Clinical Context
ctDNA dynamics require clinical context for interpretation:
- Significant decrease or clearance after treatment initiation typically correlates with response
- Stable or rising ctDNA signals treatment failure or resistance
- Pseudoprogression: tumor appearing to grow on imaging while ctDNA is falling—molecular signal overrides imaging interpretation
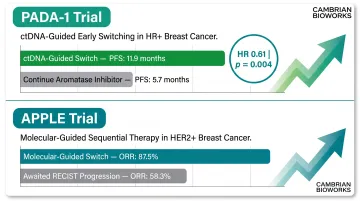
In the APPLE trial, patients who switched to osimertinib based on ctDNA-detected T790M (before RECIST progression) achieved 87.5% objective response rate vs. 58.3% for those who switched after imaging progression.
Metrics impacted: Decision confidence, false positive/negative rates, lead time before imaging changes
Step 5 – Inform Clinical Decision-Making
Map molecular findings to clinical action:
- ctDNA clearance: May support treatment de-escalation or discontinuation in certain settings (e.g., DYNAMIC trial)
- Rising ctDNA with resistance mutations: Triggers treatment switch (e.g., ESR1 mutations in PADA-1 trial prompted switch from AI to fulvestrant, doubling PFS from 5.7 to 11.9 months)
ctDNA-guided decisions are increasingly validated in prospective trials. In PADA-1, preemptive treatment switching based on rising ESR1 mutations in ctDNA yielded median PFS of 11.9 months vs. 5.7 months continuing aromatase inhibitor therapy (HR 0.61, p = 0.004).
Metrics impacted: Time to treatment change, patient outcomes, avoidance of unnecessary toxicity
Step 6 – Longitudinal Re-testing and Review
Serial monitoring provides far richer clinical information than single timepoints. Treatment response is dynamic; longitudinal ctDNA trajectories reveal resistance emergence, depth of response, and relapse risk.
Optimal re-testing intervals vary by treatment:
- After each chemotherapy cycle (every 2-3 weeks)
- Every 6-8 weeks on immunotherapy
- Every 3-6 months post-treatment for MRD surveillance
Monitoring should continue post-treatment to detect MRD and early relapse. In colorectal cancer, ctDNA-positive patients after surgery who received adjuvant chemotherapy achieved 3-year recurrence-free survival of 86.4%, demonstrating the actionability of serial ctDNA monitoring.
Metrics impacted: Detection lead time for relapse, opportunity window for curative intervention, patient survival outcomes
Clinical Walkthrough: Monitoring Therapy Response with ctDNA in Solid Tumors
Scenario: A patient with stage III non-small cell lung cancer (NSCLC) harboring an EGFR exon 19 deletion starts first-line osimertinib. The clinical goal is to track molecular response and detect acquired resistance early.
The table below summarizes how ctDNA signals evolve at each clinical decision point:
| Timepoint | ctDNA Finding | Clinical Significance |
|---|---|---|
| Baseline (pre-treatment) | EGFR mutation detectable at measurable allele frequency | Establishes molecular baseline for longitudinal comparison |
| Week 4 (on treatment) | EGFR mutation undetectable or near limit of detection | Early molecular response — precedes imaging confirmation by weeks; predicts prolonged PFS per FLAURA and AURA3 data |
| Month 9 (resistance) | ctDNA re-emerges with original EGFR mutation + new T790M resistance variant | Detected before symptoms or imaging progression — opens a lead-time window for therapy switch |
| Clinical action | Switch to T790M-targeting therapy | In the APPLE trial, molecular-guided switches achieved 87.5% ORR vs. 58.3% for those awaiting RECIST progression |
Common Mistakes and Best Practices
Mistakes to avoid:
- Skipping baseline testing leaves no reference point for longitudinal trend analysis
- Low cfDNA yield from delayed processing or poor extraction can mimic molecular response, producing false reassurance
- A single rising ctDNA result is not sufficient to act on — transient blips occur, and confirmatory serial testing prevents premature treatment changes
Best practices:
- Use validated collection tubes (Streck BCT or equivalent) and process within stability windows
- Use automated, validated extraction platforms — reproducible cfDNA quality across timepoints is essential for meaningful trend detection
- Integrate ctDNA findings with clinical and imaging data; molecular signals inform judgment, they don't replace it
- Set decision thresholds before monitoring begins (for example, ctDNA positivity triggers confirmatory testing in 3-4 weeks)
These principles translate directly into outcomes. In the DYNAMIC trial, ctDNA-guided de-escalation spared nearly 50% of low-risk patients from chemotherapy while maintaining non-inferior survival — a result that depends entirely on the quality of the molecular data upstream.
How Cambrian Bioworks Supports Accurate Treatment Response Monitoring
Cambrian Bioworks is a precision molecular diagnostics company whose automated nucleic acid extraction solutions address a frequently underestimated step in TRM workflows: high-quality cfDNA extraction. Without consistent, validated extraction, even the most sensitive downstream ctDNA assays deliver unreliable results.
Manta: Purpose-Built for Clinical cfDNA Workflows
Manta is Cambrian's CE-IVD-certified automated cfDNA extractor, designed for clinical diagnostic labs. Key capabilities for TRM workflows:
- Completes cfDNA extraction in ~30 minutes, accelerating turnaround for labs managing serial monitoring samples
- Uses magnetic bead-based technology to selectively capture cfDNA fragments while excluding leukocyte-derived DNA, minimizing genomic contamination
- Integrates with ddPCR, NGS, and methylation sequencing platforms without vendor lock-in (open system)
- Handles 1–32 samples with random access — no batching pressure for unpredictable serial monitoring schedules
- Automated UVC decontamination between runs, reducing cross-contamination risk for low-frequency variant detection
- Touchscreen interface with remote monitoring and log export for quality assurance and regulatory compliance
Manta is manufactured under ISO 13485-certified quality management, ensuring the reproducibility and standardization that clinical TRM workflows demand. It holds CDSCO IVD certification (MFG/IVD/2025/000069) and CE-IVD marking under IVDR Regulation (EU) 2017/746, meeting rigorous European standards for clinical diagnostics.
The OncoSeek cfDNA Extraction Kit
Manta pairs with Cambrian's OncoSeek cfDNA Isolation Kit, which is optimized for oncology workflows including MRD detection, ctDNA analysis, and liquid biopsy. Validated together, they deliver:
- 5–20× higher cfDNA yield from 1 mL plasma, compared to competitors requiring 2 mL
- Preferential capture of tumor-derived cfDNA fragments (150–200 bp), improving detection sensitivity
- Cell-free fraction >45% for critical fragment sizes, with minimal gDNA contamination
- Average yield of 100–1,000 ng for tumor-positive samples
In clinical validation across seven patient samples, OncoSeek demonstrated higher cfDNA recovery and purity, confirmed via TapeStation cfDNA ScreenTape analysis.
Trusted by Leading Oncology Centers
Cambrian Bioworks is trusted by 67+ labs globally, with a growing presence in oncology centers including Tata Memorial Hospital, ACTREC (Advanced Centre for Treatment, Research and Education in Cancer), and Strand Life Sciences. These institutions use Manta for advanced clinical cancer research, FFPE-based tumor profiling, and blood cancer diagnostics.
Connecting Pre-Analytics to Clinical Decisions:
Reliable pre-analytics means oncologists can trust their ctDNA data for high-stakes treatment decisions. When cfDNA extraction is inconsistent, molecular signals become ambiguous: rising ctDNA may reflect extraction variability rather than true progression, and false-negative results can delay critical treatment switches.
Cambrian's solutions standardize this foundational step so labs can implement TRM workflows with greater confidence. To explore how Manta fits your workflow, contact Cambrian Bioworks at connect@cambrianbioworks.com or +91 78922 39793.
Frequently Asked Questions
What is response monitoring?
Treatment response monitoring is the ongoing process of evaluating whether a patient's cancer is responding to therapy using clinical, radiological, or molecular measurements. It guides real-time decisions about continuing, modifying, or stopping treatment based on evidence of efficacy or resistance.
What does ORR mean in cancer?
Objective Response Rate (ORR) is the percentage of patients who achieve a measurable reduction in tumor burden—partial or complete response—in response to treatment. It is a primary endpoint in many oncology trials used to evaluate drug efficacy.
What is the difference between EFS and DFS?
EFS measures time from treatment start to any defined negative event — progression, relapse, or treatment failure. DFS tracks time from complete remission to recurrence or death, and is used specifically in resected cancers. EFS is broader, applying to both adjuvant and neoadjuvant settings.
What is the TPM system for cancer?
In oncology, TPS (Tumor Proportion Score) measures the percentage of tumor cells expressing a biomarker like PD-L1 and is used to guide immunotherapy eligibility. In liquid biopsy contexts, TPM relates to tumor fraction estimation — quantifying ctDNA burden from blood samples.
What is ctDNA and how is it used to monitor treatment response?
Circulating tumor DNA (ctDNA) consists of cancer-derived DNA fragments shed into the bloodstream and detected via liquid biopsy. Rising or falling ctDNA levels signal whether therapy is working, often weeks before changes appear on imaging.